What’s new in version 24.1?
What’s new in version 24.1?
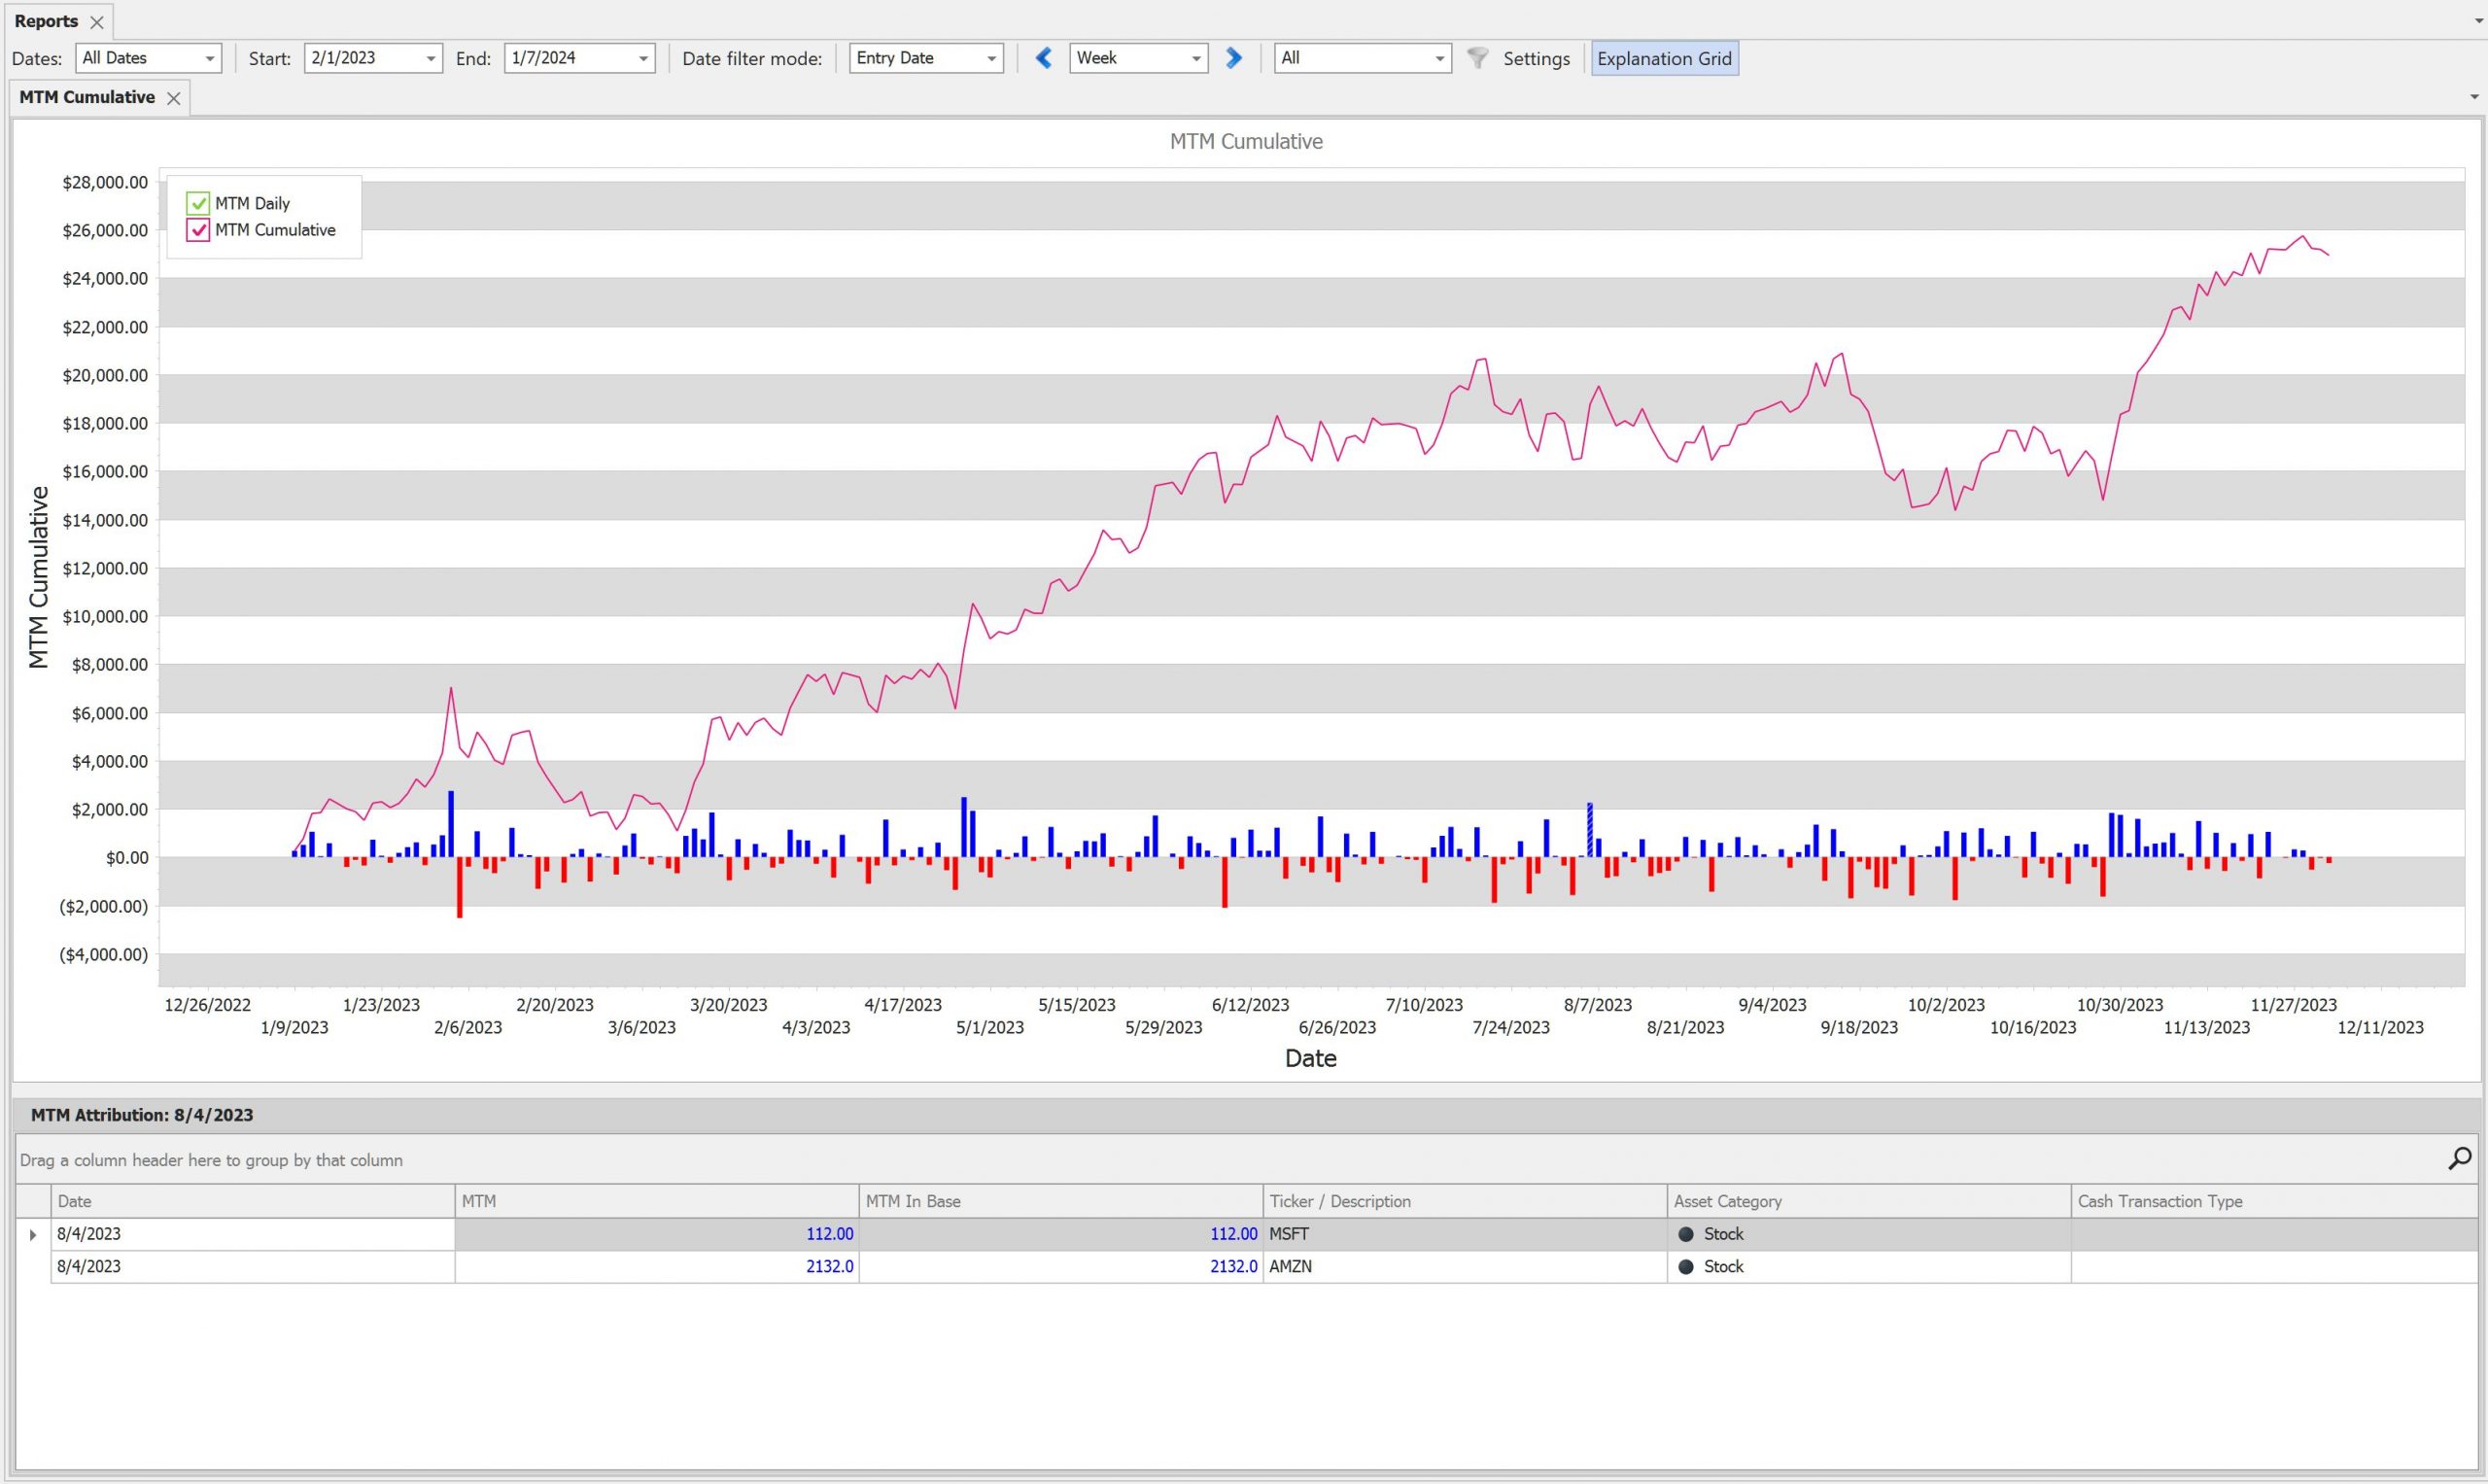
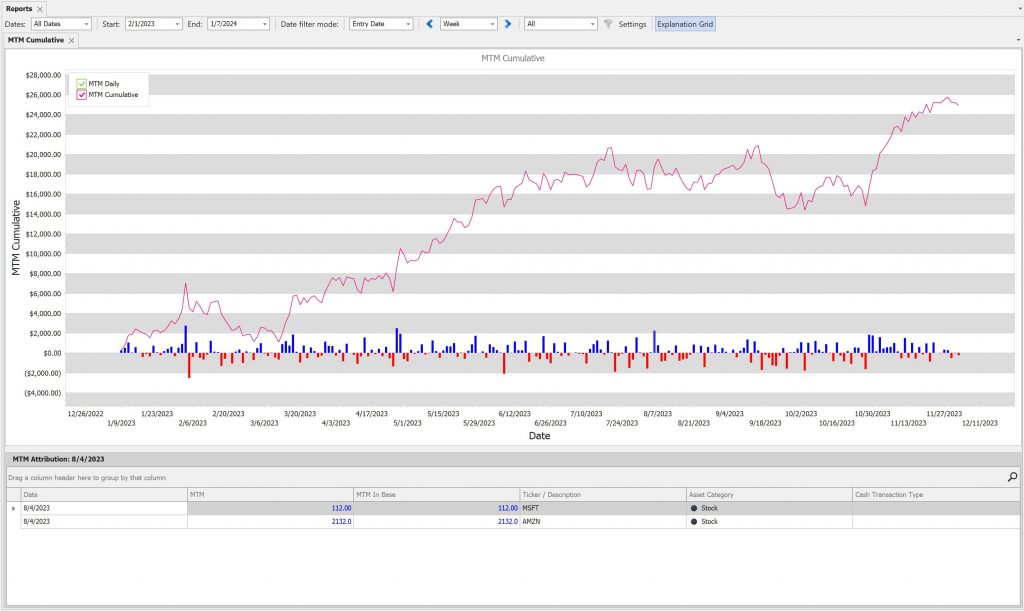
MTM Cumulative report
A new report group, including a new report called Market‑To‑Market (MTM) Cumulative, has been added. MTM reports are based on historical data and show the daily gain or loss compared to the previous trading period (daily by default).
The MTM Cumulative report shows the market to market values in a bar chart and the MTM cumulative values in a line chart. The report also has a attribution grid which shows the exact values per ticker for a particular period. Click on the bar to check the attribution values.
Please note that MTM values are available only if the instrument has historical data.
Settings
The screenshot below shows the settings for the Market‑To‑Market Cumulative report.
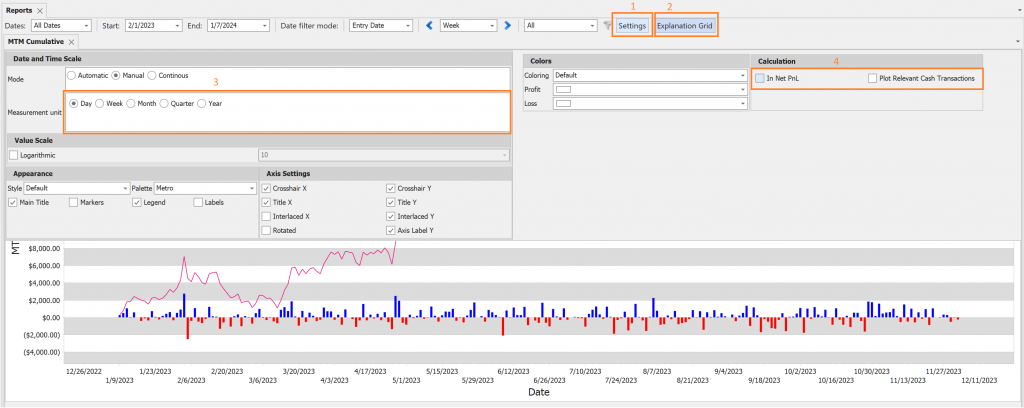
Click the Settings button to open the floating panel.
Use the toggle to turn the attribution panel on or off.
Choose the bar interval: daily (default), weekly, monthly, quarterly, or yearly.
Adjust calculation-related parameters.
Explanation grid added to five existing reports.
The new explanation grid has also been introduced in the following five existing reports:
- Holding Time Distribution
- PnL Instrument Distribution
- PnL Filter Distribution
- PnL Tag Distribution
- PnL By Spread Type