TradingDiary Pro basics and data types.
Data Types
This article explains how various data and transaction types are handled in TradingDiary Pro, and how these types relate to each other. Both imported and manually added entries include:
- Instruments
- Trades
- Cash Transactions
- Total Equity / Net Asset Value
- Exchange Rates
- Historical Data
Instruments
A trading instrument can be a stock, futures contract, option, futures option, Forex pair, warrant, CFD, etc. TradingDiary Pro supports all major instrument types. Instruments are added either automatically during import or manually. The Instruments view lists all existing instruments. You can find more information about it at web help
Trades
Trades represent the raw executions made via an exchange or FX broker. For example, purchasing 1,000 Tesla shares appears as a row in the Trade Blotter View. Each trade must be linked to an instrument, so ensure instruments are imported or created ahead of time. Essential trade fields include trade date/time, quantity (positive for buys, negative for sells), price, commission, and currency. Partial fills result in multiple rows in the blotter. Each trade receives a unique transaction ID (from your broker or generated by the software). To edit a field, double-click the cell—similar to Excel.
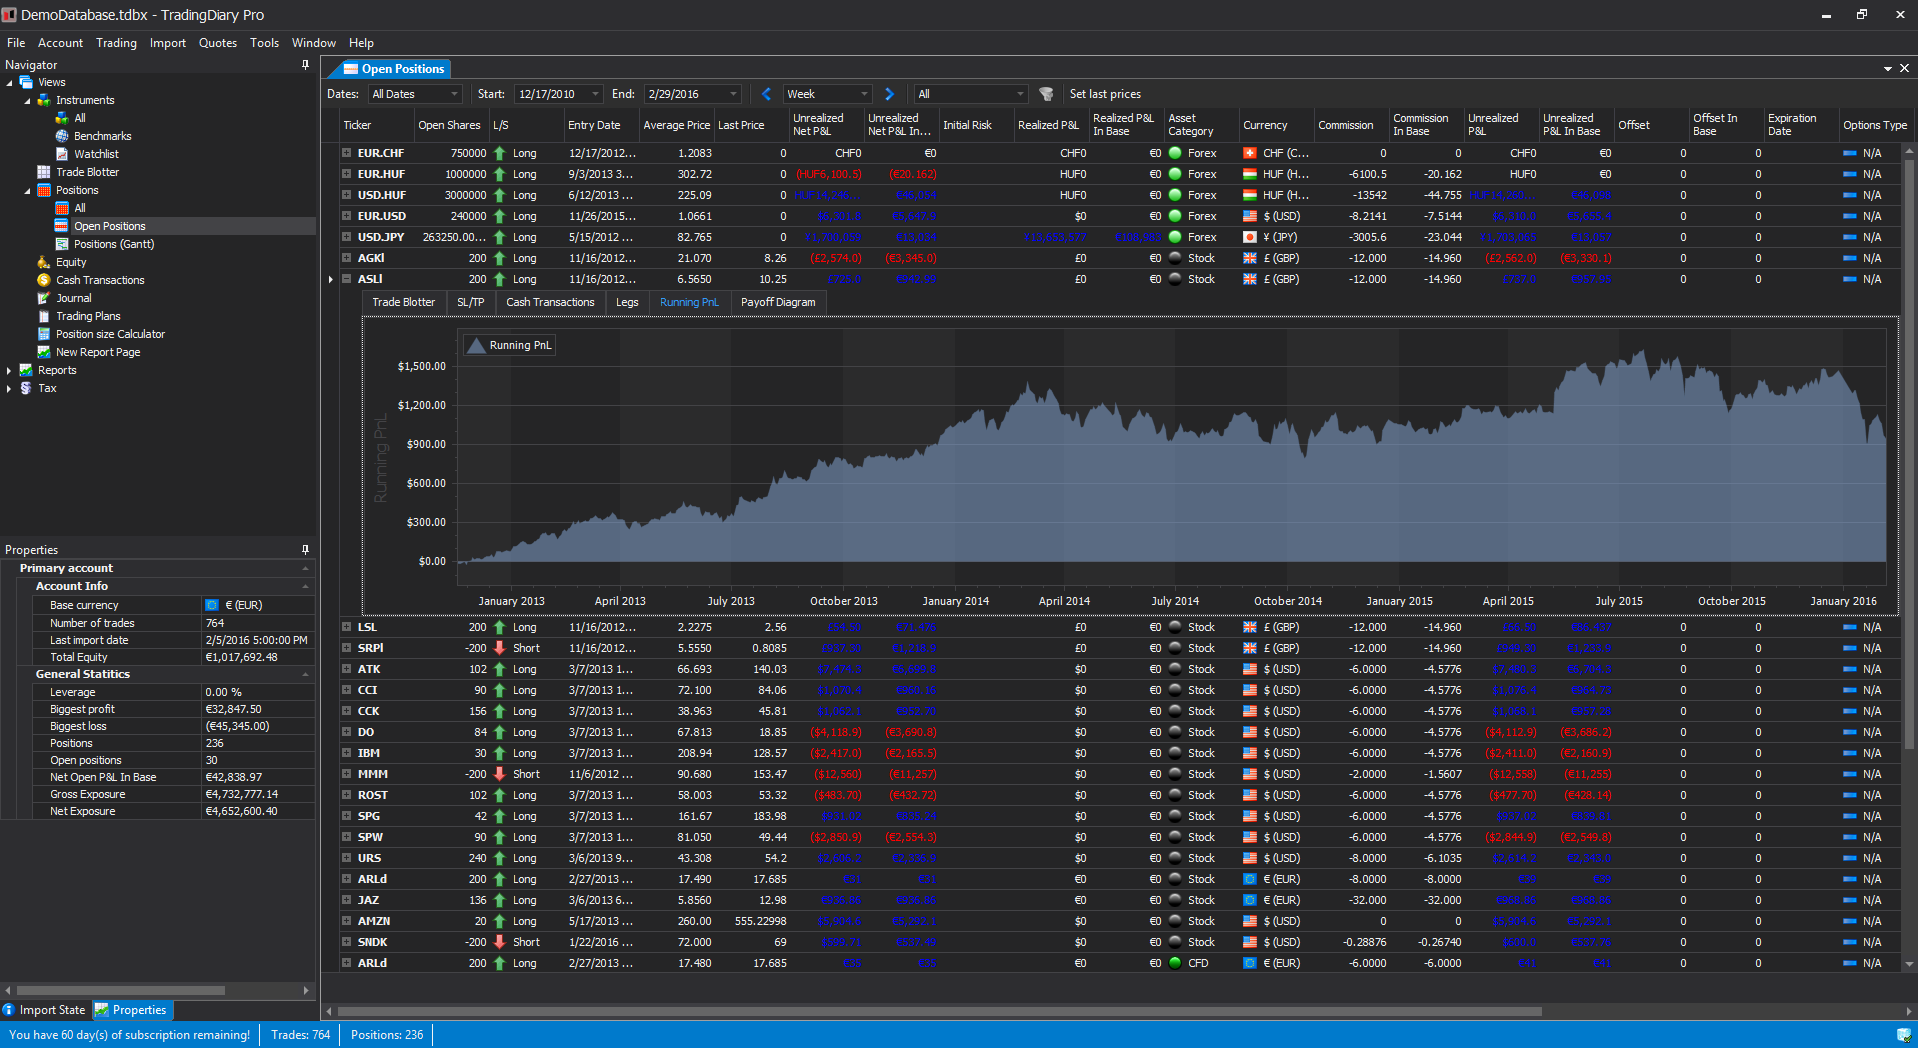
Positions
A position aggregates related trades. Every trade contributes to positions:
- A position with one trade is considered open.
- A position is closed when the net trade volume equals zero (e.g., buy 100 → sell 100).
TradingDiary Pro uses FIFO (First in, first out) algorithm for auto-assignment, with an FX specific method available for imports from MetaTrader or FXCM. Manual overrides are supported. Learn more here.
After assignment, the system calculates metrics like PnL, Net PnL, total commissions, and more. Results appear in the Positions and Open Positions views.
Cash Transactions
Cash transactions are non-trade entries—such as deposits, withdrawals, dividends, withheld dividends, taxes, paid/received interest. Most can be linked to positions (excluding pure deposits/withdrawals), adjusting that position’s Net PnL. This improves PnL tracking accuracy. Review these in the Cash Transaction View.
Total Equity/Net Asset Value
Net Asset Value (NAV) reflects the daily sum of all assets and liabilities at the day’s close. Some brokers (e.g., Interactive Brokers) offer NAV histories, but if not, TradingDiary Pro computes NAV using cash transactions, positions, and historical prices. This NAV series is used throughout equity-based reports—such as Equity History, Leverage, ROI Pivot Table, Risk Metrics, and the top section of the Performance view.
Exchange Rates
When trading in non‑base currencies (for instance, trading USD instruments in a EUR‑based account), TradingDiary Pro uses historical exchange rates from broker statements to calculate PnL in the base currency. Learn more about multi‑currency PnL calculations here.