Position Size Calculator
Position Sizing
One of the most important things in your trading is risk management. Proper position sizing is the key factor to manage your risk and prevent a single trade from blowing out your account. With a few simple inputs TradingDiary Pro’s position size calculator helps you to calculate the appropriate size before you enter a trade.
How it works
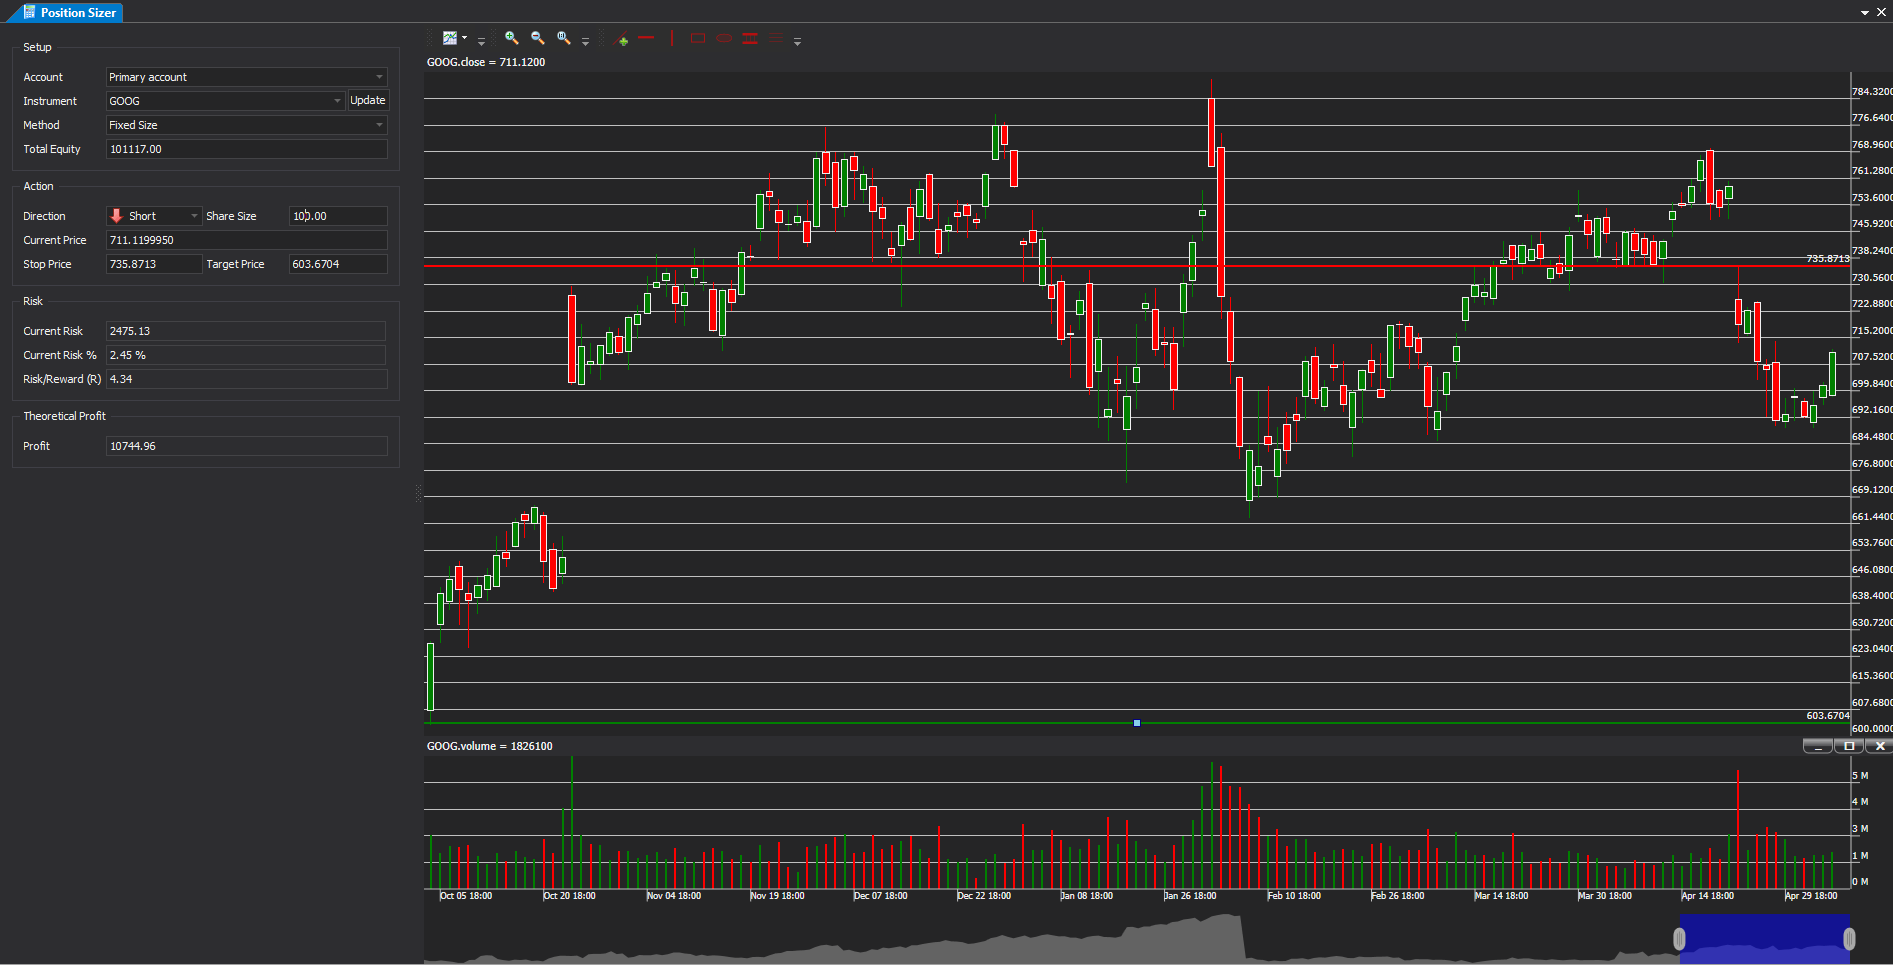
Start TradingDiary Pro. In the Navigator window double click on the Position Size Calculator. The position sizer window is shown.
The view consists of two parts. The first is the input area where you can set inputs like account, sizing method, long or short etc. and the second one is a chart view where you can set the stop and target lines by drag and drop method.
Let’s see the first part, the input area.

In the Setup you first have to set the account. If your database contains only one account then it’ll be selected automatically. The next step is to select the instrument. With the optional Update button you load the latest historical data into the chart.
In the action section you can set the position direction (Long or Short), the current price, stop and target price. Please note if you drag and drop the stop and target lines on the chart these values will be updated as well.
The risk section shows the different risk metrics. The current risk, the current risk percent to the total equity, the maximum risk, the maximum risk to total equity and the Risk Reward.
The last section is the theoretical profit. This is what you would earn if your target were filled.
Position sizing methods
There are three different position sizing methods supported at the moment.
Fixed size
With fixed size method you can set how many shares/contracts you would like to buy or sell and the software calculates the risk metrics and the theoretical profit.
The workflow is the following:
- Set account
- Set instrument
- Set method to fixed size
- Set direction
- Set the share/contracts size
- Drag and drop the stop and target lines on the stock chart
Fixed amount of risk
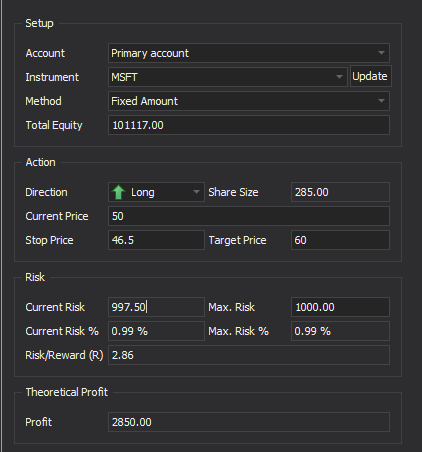
With fixed amount method you can define how much risk you would like to take on. You set the maximum risk and the software calculates how many shares you can buy or sell. For example Microsoft traded at $50. You would like to enter into a long position and you set your stop at 46.5. You would like to take $1000 risk. You take $3.5 risk on each share, 1000/3.5 = 285.7. This means that you can buy 285 shares and your current risk will be 285 x 3.5 = 997.5. Please check the screenshot.
The workflow is the following:
- Set account
- Set instrument
- Set method to Fixed amount
- Set the direction to Long or Short
- Set the Max. Risk
- Drag and drop the stop and target lines on the stock chart
Percent of Risk
With the percent of risk method you can set how much risk of your account you would like to take. The latest Total Equity value of your account is used otherwise you have to set it manually. The calculation is very similar to the fixed amount. The risk amount is calculated from the entered risk percentage and from the total equity. For example your account total equity is $100,000. You would like to take 1% of risk. This is $1000. From that point the calculation is the same as what is applied for the fixed amount method.
The workflow is the following:
- Set account
- Set instrument
- Set method to Percent of risk
- Set the direction to Long or Short
- Set the Max. Risk %
- Drag and drop the stop and target lines on the stock chart