Position related risk metrics
Effective risk management is crucial for successful trading, particularly in leveraged environments. It helps minimize losses and protects your account from being wiped out. TradingDiary Pro includes several risk-related metrics—beyond Equity/Net Asset Value reports—that this article covers in detail.
In the positions or open positions view there are several risk related columns:
- Stop
- Target
- Initial Risk
- Initial Risk %
- Current Risk
- Current Risk %
- R Multiple
- Risk/Reward
Formulae behind the columns
$$\text{Initial Risk} = {(\text{Entry Price} – \text{Stop Price}}) \times \text{Multiplier} \times \text{Quantity} \times \text{Exchange Rate}$$
$$\text{Initial Risk %} = \frac{\text{Initial Risk}}{\text{Equity value at entry date}}$$
$$\text{Current Risk} = {(\text{Current Price} – \text{Stop Price}}) \times \text{Multiplier} \times \text{Quantity} \times \text{Exchange Rate}$$
$$\text{Current Risk %} = \frac{\text{Current Risk}}{\text{Equity value at current date}}$$
$$\text{R Multiple %} = \frac{\text{Net Profit in base}}{\text{Initial Risk}}$$
$$\text{Reward/Reward} = \frac{\text{Reward}}{\text{Risk}} = \frac{|\text{Average Open Price} – \text{Stop Price}|}{|\text{Target Price} – \text{Average Open Price}|}$$
Note: These formulas apply to standard positions. Options spreads use different calculations due to their complexity
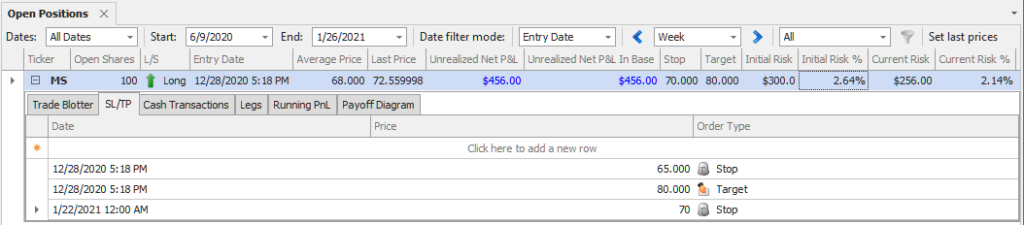
Adding Stop‑Loss and Target Levels
To enable risk calculations, you must set at least one stop-loss; for R/R (Risk/Reward) metrics, a target is also required. Expand the position and navigate to the SL/TP tab to add these:
- Click the top empty row.
- Enter the date, price, and choose order type (stop or target).
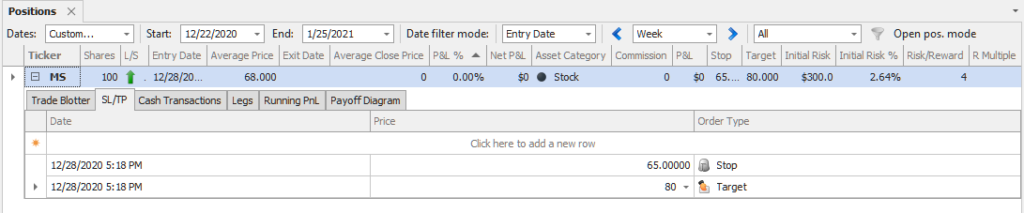
Once configured, TradingDiary Pro computes metrics automatically. For example:
- Entry: $68
- Stop: $65
- Quantity: 100 shares
- Multiplier: 1
- Exchange rate: 1
- Initial Risk = ($68 – $65) × 100 = $300
- Equity on 12/28/2020 = $11,381 → Initial Risk % ≈ 2.64%
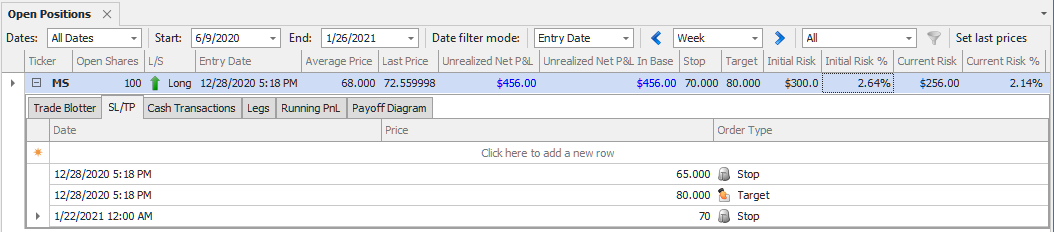
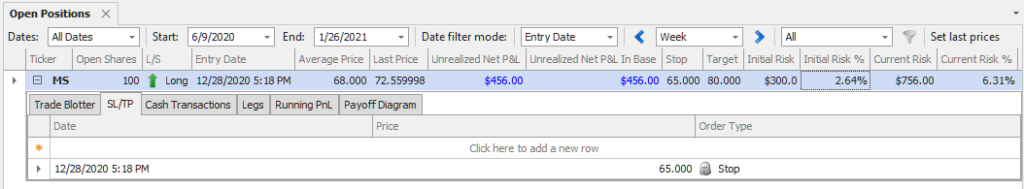
If the price rises to $72.56 by 1/25/2021:
- Current Risk = ($72.56 – $65) × 100 = $756
- Equity = $11,989 → Current Risk % ≈ 6.31%
After setting a target (e.g., $80), with a stop at $65:
- Risk/Reward = (80 – 68) ÷ (68 – 65) = 4 → Risk/Reward = 4
Adjusting Stops Mid‑Trade
When you modify the stop level during a trade, Current Risk updates accordingly—but Initial Risk remains based on the original stop.
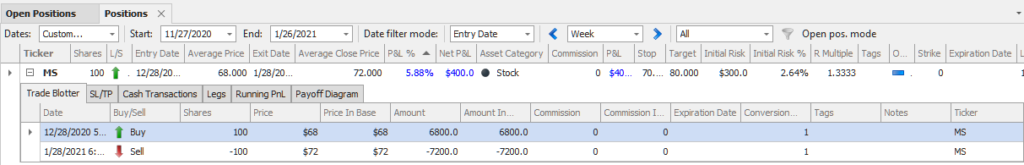
R‑Multiple on Exit
Upon closing a position (e.g., at $72):
- Initial Risk: $300 ($3 per share)
- PnL: $400 ($4 per share)
- R Multiple = 4 ÷ 3 ≈ 1.33