MAE and MFE explained
There are several important indicators in your trading like profit and loss, timing and so on. One of them is the price action during the trade. Read this article to learn about MAE and MFE and how TradingDiary Pro calculates them.
What does MAE mean?
- MAE stands for Maximum Adverse Excursion
MAE marks the lowest price during a long trade and the highest price during a short trade. This helps you to identify what the maximum loss was during a trade. This is also known as maximum drawdown of the position.
What does MFE mean?
- MFE stands for Maximum Favorable Excursion.
MFE marks the highest price during a long trade and the lowest price during a short trade. This shows you what the highest profit was during a trade.
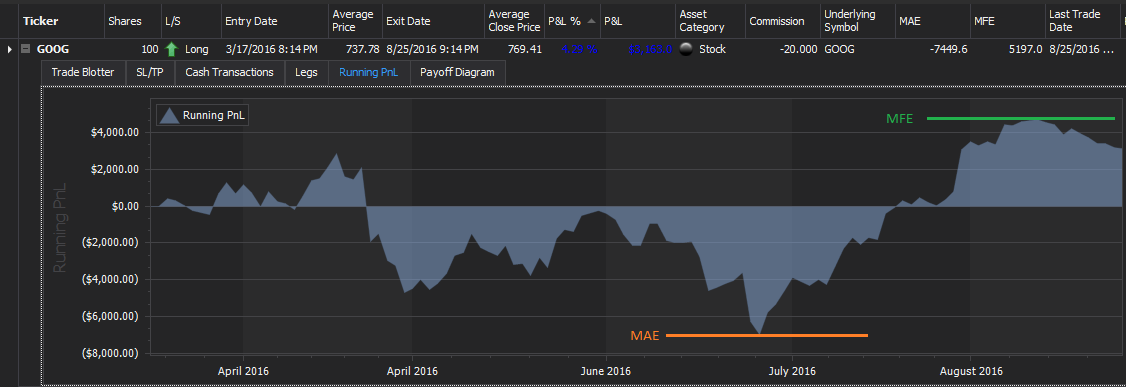
The following screenshot is the Running PnL of a trade captured from the software.

If a trade was never in the loss which means that the price of a long trade was always higher than the entry price or the price of a short trade was always lower than the entry price the MAE is zero. This is the best situation a trader can have. The opposite of that is if the trade immediately turns against you and the position was never in the profit zone then the MFE is zero.
Analysis
Analyzing MAE and MFE values can help you optimize your exit strategies.
- If the MFE is usually much higher than the profit of the trade it means that you leave too much on the table. You should apply a trailing stop to protect your already earned profits
- If the MAE is much lower than the loss it means you don’t apply stops.
- If the MAE is very far from the entry price it means that your risk tolerance may be too high
Calculation
TradingDiary Pro automatically recalculates the MAE and MFE values after a successful historical price data update. The MAE and MFE values are calculated in the base currency which means that the exchange rate moves could also modify the results for trades in foreign currency. The logic behind the scenes is that the software gets the first bar which does not include the entry date and recalculates the profit and loss values for each historical bar. The better the granularity of the data, the more accurate the results. If you hold positions for longer terms from several weeks to years having daily historical data will be enough. If you hold your position for intraday or just a couple of days you will need intraday data as well.
Reports
Currently there are two reports based on the MAE MFE metrics.
Maximum Adverse Excursion vs Trade outcome
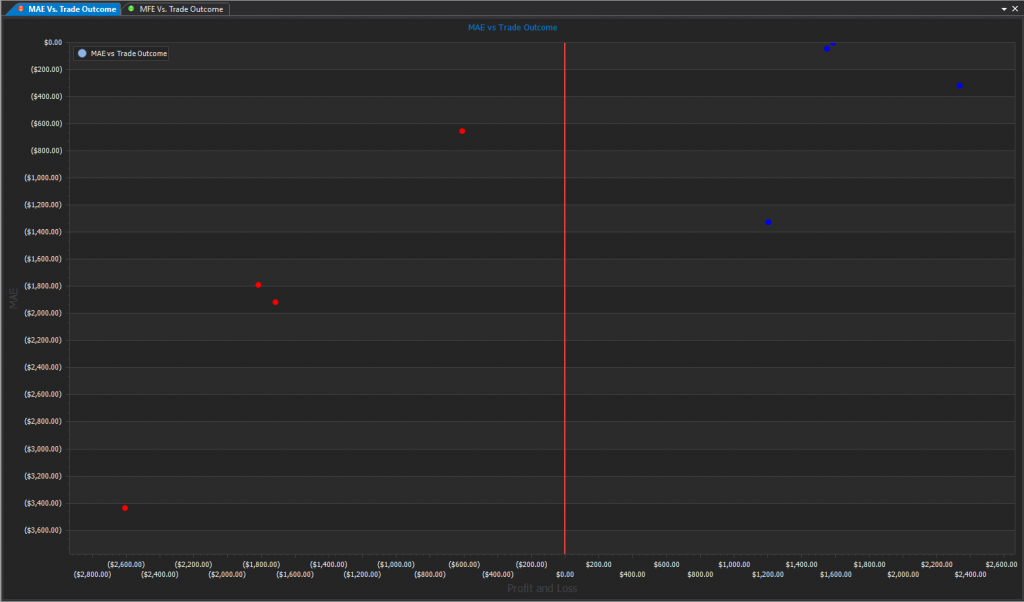
In this report the numbers on the horizontal axis are the Profit and Loss and the numbers on the vertical axis are the maximum adverse excursion. The red dots show the losing trades and the green dots are the winning trades. The small vertical line is the zero.
What do these dots mean? Let’s divide the chart into 2 sections, the left and the right one.
The left side shows the losing trades. For a disciplined trader the red dots should follow a diagonal line starting from the origin (zero point) to the bottom left. If a trade goes against him or her it will be closed at the maximum loss by activating a stop loss.
The right side shows the winning trades. The blue dots should be grouped into the zero line. This means that there was not too much drawdown on those trades.
Maximum Favorable Excursion vs Trade Outcome
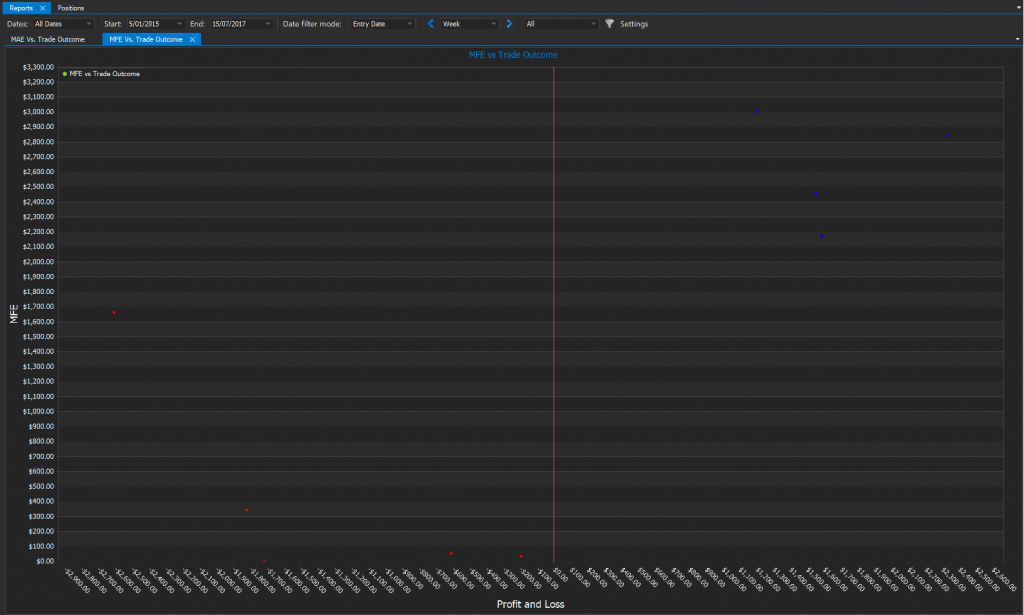
In this report the numbers on the horizontal axis are the Profit and Loss and the numbers on the vertical axis are the maximum favorable excursion. The red dots show the losing trades and the green dots are the winning trades. The small vertical line is the zero.
As you can see this chart is inverse of the previous chart.
The left side shows the losing trades. The red dots tend to the zero line. This means that the losing trades did not go too much into the profit space before they returned and being a loss trade. This is the optimal situation which means that not too much profit was left on the table before the positions were closed in profit. However there is one trade in the red dots which MFE was around $1650 but the trade was closed with a relatively high loss ($2600). This is what all traders have to avoid and this is a space for the improvement of one’s trade.
If you would like to check how it works live in the software you can download the database from here. Please do not open it from the web browser. Save the file first. Start TradingDiary Pro and open the file from the previously saved folder.