Calculating Sharpe Ratio with TradingDiary Pro
Sharpe Ratio
Sharpe ratio was developed by the Nobel Prize winner William F. Sharpe and it has been one of the most referenced risk/return measures used in finance.
The ratio describes how much excess return you are receiving for the extra volatility that you take for holding a riskier asset.
It is calculated with the following formula:
$$S_{a} = \frac{\text{Effective Return}}{\text{Standard Deviation}} = \frac{E[R_{a}-R_{b}]}{\sigma_{a}} = \frac{E[R_{a}-R_{b}]}{\sqrt{var(R_{a} – R_{b})}}$$
where \(R_{a}\) is the asset return, \(R_{b}\) is the return on a benchmark asset such as the risk free rate of return or an index such as the S&P 500. Usually \(R_{b}\) is the best available rate of return of a risk free security (T-Bills).
\(E[R_{a}-R_{b}]\) is the expected value of the excess of the asset return over the benchmark return, and \(\sigma_{a}\) is the standard deviation of this excess return.
The Sharpe ratio uses standard deviation to measure portfolio’s risk-adjusted returns. The higher a portfolio’s Sharpe ratio, the better a portfolio’s returns have been relative to the risk it has taken on.
A general rule of thumb is that a portfolio above Sharpe ratio 1 is good, above 2 is super and above 3 is excellent.
That’s the theory. Let’s see what it means in practice. There are two portfolio managers with two different yearly track records but with almost the same end result.
Portfolio A
| Time Period | Portfolio Value | Yearly Returns | Risk Free Rate | Excess Return |
| 0 | 10000 | |||
| 1 | 11000 | 0.1 | 0.05 | 0.05 |
| 2 | 11880 | 0.08 | 0.05 | 0.03 |
| 3 | 13068 | 0.1 | 0.05 | 0.05 |
| 4 | 14113.4 | 0.08 | 0.05 | 0.03 |
Average Excess Return: 0.04
Standard Deviation: 0.01155
Sharpe Ratio: 3.46
Portfolio B
| Time Period | Portfolio Value | Yearly Returns | Risk Free Rate | Excess Return |
| 0 | 10000 | |||
| 1 | 12000 | 0.2 | 0.05 | 0.15 |
| 2 | 11040 | -0.08 | 0.05 | -0.13 |
| 3 | 12144 | 0.1 | 0.05 | 0.05 |
| 4 | 14147.76 | 0.165 | 0.05 | 0.115 |
Average Excess Return: 0.046
Standard Deviation: 0.1246
Sharpe Ratio: 0.37

Value added yearly index for portfolio A and B
The difference between the two portfolios is that Portfolio B is more volatile. This means it is more risky however the returns are the same for both Portfolios. The logical choice is Portfolio A. It is reflected in the Sharpe ratio as well because Portfolio A has a much higher ratio than Portfolio B.
How it works in TradingDiary Pro
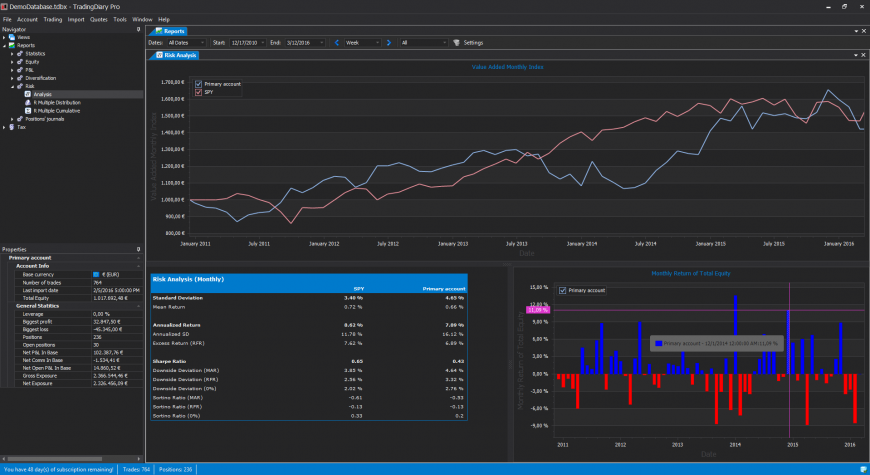
TradingDiary Pro is able to calculate Sharpe ratio. Even more you can check the annualized values as well by: Weekly, Monthly and Yearly. To check the Sharpe ratio of your portfolio please open the Risk analysis report from the Navigator window (Reports/Risk/Analysis).

To change Sharpe ratio initial parameters the risk free rate, the minimum acceptable return and the annualization click on the Settings button next to the filter selector.

If you would like to check how it works live in the software you can download the database from here. Please do not open it from the web browser. Save the file first. Start TradingDiary Pro and open the file from the previously saved folder.