How Net Asset Value history is calculated
Most of the brokerage firms provide information only about your recent or past trades. They do not provide info about how your whole account has been performing over time. If you have mid and long term positions it’s important how your overall portfolio performs over time.
What is Net Asset Value or Total Equity?
Total Equity or Net Asset Value is the value of all assets minus liabilities of your account at the end of day. The Net Asset Value history is calculated over time based on the initial deposit, the trade history, transactions history like dividends, deposits and withdrawals, interest paid and received and the historical end of day prices.
Why is it important?
One of the most important risk metrics is how much money you put on the table with one trade. Ok, you know current total equity but do you know what it was 3 months ago? Do you know what your leverage was, what your drawdown was or what your total risk was as at that time? Probably you don’t, and this important information is completely lost over time. This means that you lose a very important part of the whole picture.
TradingDiary Pro helps you. If your brokerage firm (for example Interactive Brokers) supports it the total equity history will be stored. If it does not then the software is able to calculate it based on your transactions.
How it is calculated in TradingDiary Pro
The first value is the initial deposit. You can add it from the Cash Transactions view. To do so please click on the first row of the cash transactions grid, set the date, the value and set the type to Deposit. Click outside the row so the line will be added to the database.

If it’s a fresh database a couple of trades need to be added. In this example in the database two positions have been added.

The next step is simply to click on the Trading/Generate to equity menu. The software recalculates the daily gains and losses for all positions and sums them up, adjusts the values with cash transactions like dividends and interest rate paid and received. Please note you have to set a quote download module first because to calculate the daily equity values end of day prices are needed for all positions.
After the total equity has been generated, all equity-related reports have data. You can calculate your drawdown, leverage, you can compare your account’s performance against the benchmarks, or even check your account’s Sharpe Ratio. You can use the current equity value to calculate your risk in the Position Size Calculator.
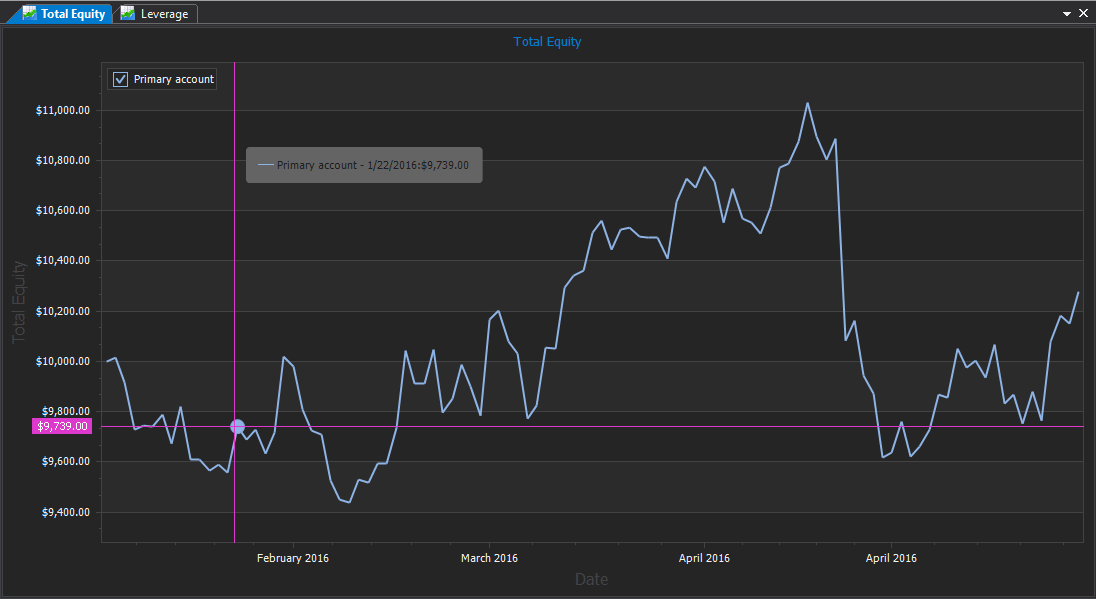
This is the equity history based on the two positions and the initial cash transaction:

This is the leverage report:

If you would like to check how it works live in the software you can download the database from here. Please do not open it from the web browser. Save the file first. Start TradingDiary Pro and open the file from the previously saved folder.